This overview explains the essential elements of this powerful lean practice.
Too often, lean practitioners begin value-stream mapping without fully understanding what it is, why it is a vital part of a lean transformation — and even some basics as to what information is gathered and presented with the practice. So, here is a primer on what you need to know to leverage VSM to chart your lean journey.
Value-stream mapping (VSM) is a fundamental lean practice that involves diagraming a value stream, which includes all the actions (value-creating and nonvalue-creating) needed to move a product or service from raw material to the arms of the customer, including the material and information flow. Lean practitioners use the process and the resulting map to identify and eliminate waste.
Toyota developed the practice and tool (which it calls a material and information flow diagram) as a critical part of the Toyota Production System.
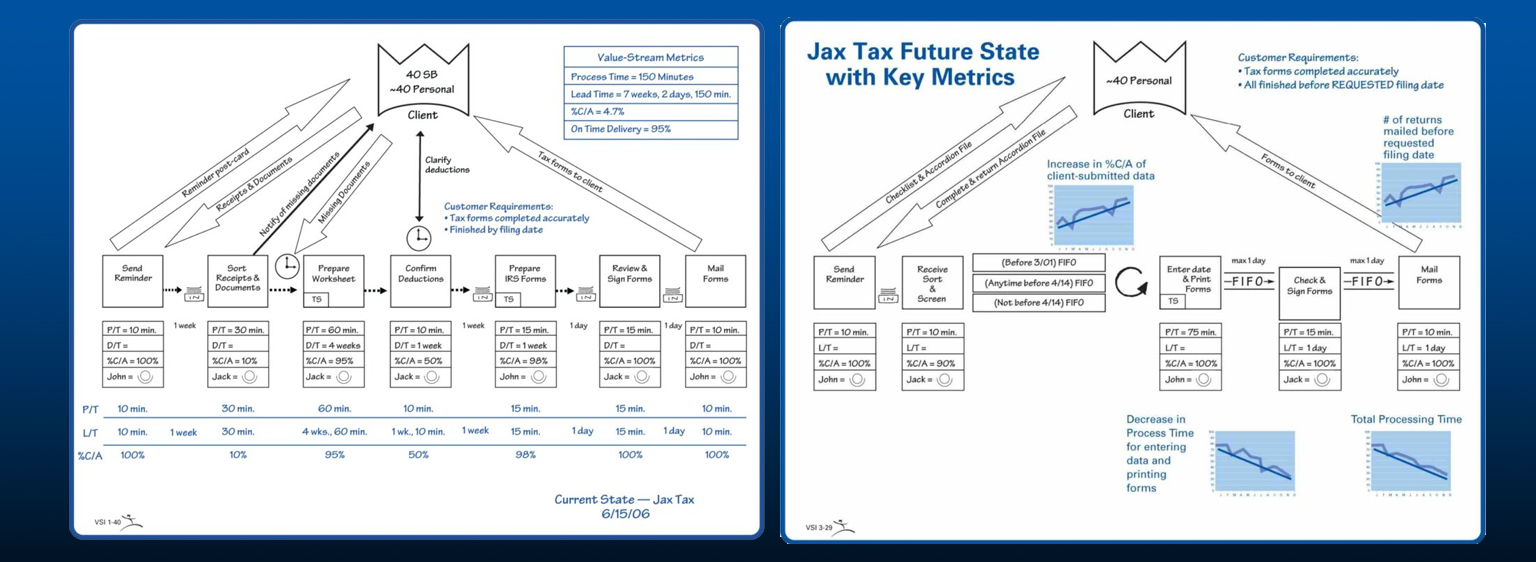
Value-stream mapping typically begins with a team creating a current state map by capturing the actual condition of a value stream’s material and information flow.
Subsequently, the team draws a future state map, a target image of how the material and information should flow through the value stream. Repeatedly doing the value-stream mapping process is the simplest and best way to teach yourself and your colleagues how to see value-adding versus nonvalue-adding process elements.
Most commonly used in lean manufacturing, value-stream mapping has been proven effective in any industry.
The main intention of current state mapping is to try to understand the dock-to-dock, or start-to-finish, flow, not to draw a perfectly accurate depiction. The primary reason for future state mapping is to visualize the vision of the improved value stream. So value stream mapping:
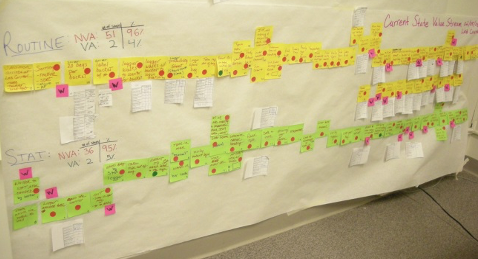
Generally, value-stream maps show specific types of information in a standardized way. So, the information flow is in the first row or line. The process steps are in the second, with process data boxes (metrics) immediately below each step. And the timeline and summary statistics – the value stream’s key process indicator (KPI) data at the bottom.
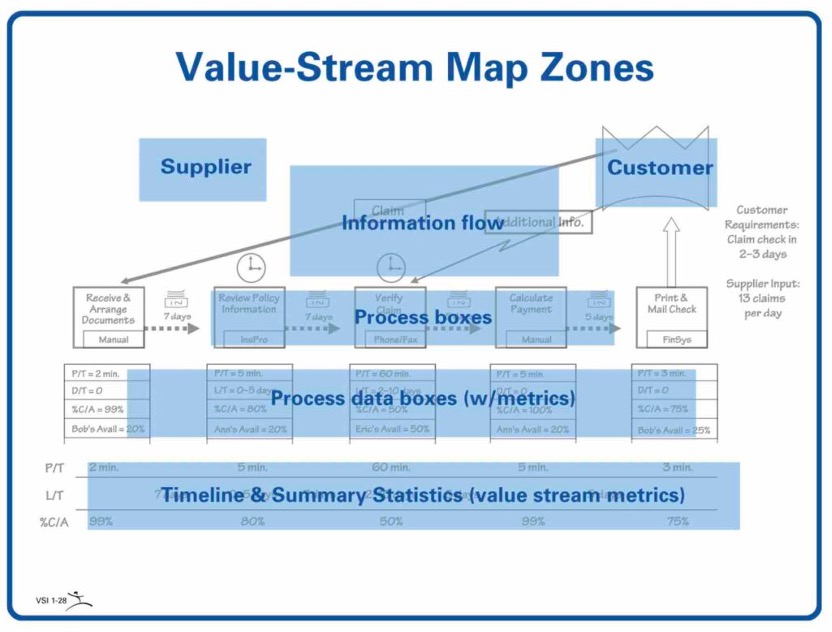
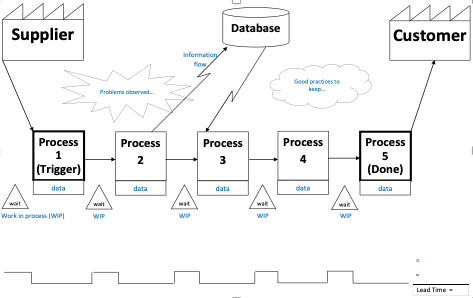
Information flow tells each process what to make or do next and when to do it.
Process boxes depict the steps of product or service delivery in a value stream. Because drawing a box for every process step would make the map unwieldy, use the process box to indicate one area of material flow. The process box stops wherever processes are disconnected, stopping the material flow.
Process data boxes detail essential information and metrics about each step, including:
Timeline & Summary Statistics (Value-Stream Metrics) record a summary of the metrics.
When you want to “see” and improve the big picture — all the process steps needed to deliver a product or service from customer order or raw materials to delivery, value-stream mapping helps prioritize where efforts will yield overall improvement. Alternatively, when you want to improve a specific process or operation within the value stream, process mapping enables a detailed look at each step, allowing you to determine specific, targeted improvements.In other words, value-stream mapping is about improving the entire value stream, not just the parts, while process mapping is about improving a specific process within a value stream.
Value Stream Mapping (VSM)
Process Mapping
What
Why
When
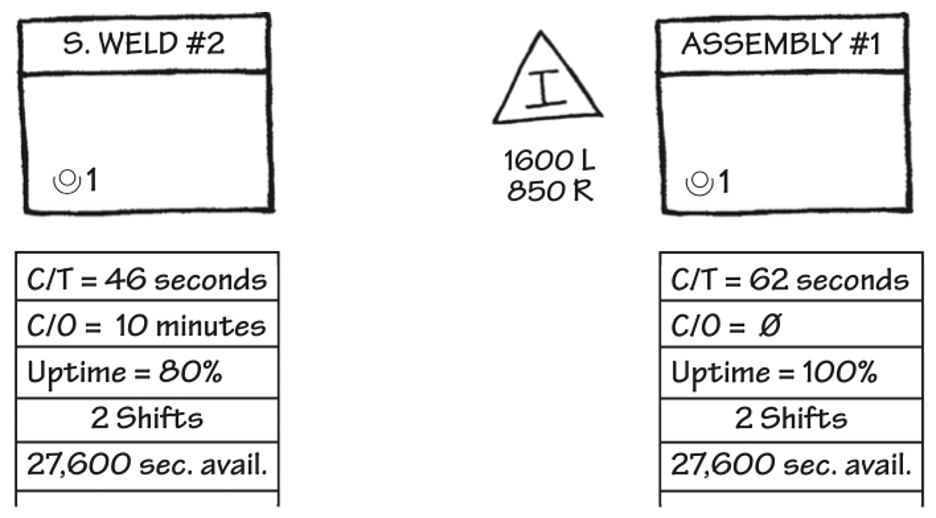
A Closer Look at Process Data
An example of process data boxes in a value stream map shows the type of detail that value-stream mapping captures.
Using standardized icons, such as those shown below, for each action depicted on a value-stream map ensures that everyone can “read” them. Download these value-stream mapping icons.
![]()
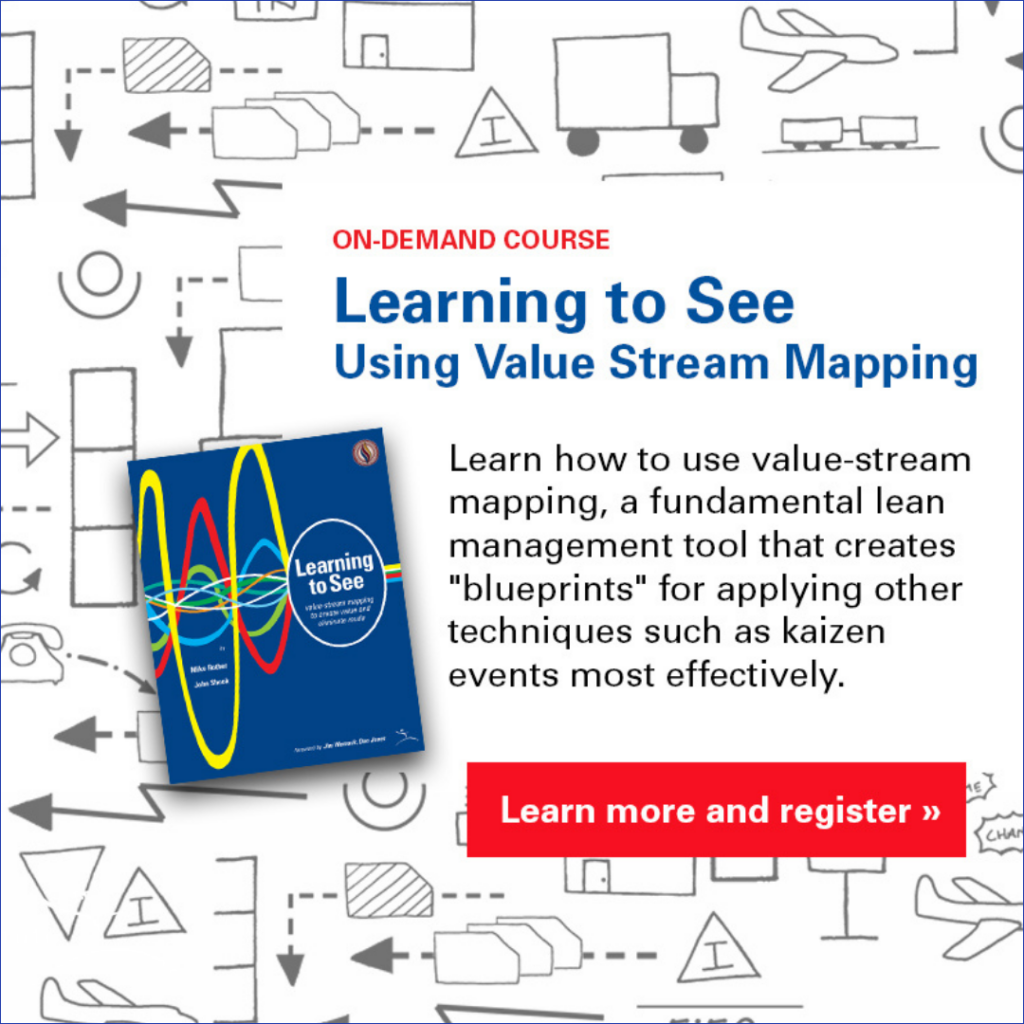
Continue your learning with our go-at-your-own-pace, On Demand Online Course: Learning to See Using Value Stream Mapping, faithfully based on the innovative content in the landmark Learning to See workbook that introduced value-stream mapping to the world.
Develop a blueprint of improvements that will achieve your organization’s strategic objectives.
Lean LeaperAbout Lean Leaper
Comments (4) August 15, 2024 at 9:22 amThe what why when section appears misaligned. It seems that it should be a table because different items refer to VSM or process making.
December 19, 2022 at 1:22 pmIf there is no vsm , there is no real, steady improvement.
September 2, 2022 at 10:28 amThank you for this overview!
The ad which is placed in the text promoting the “Learning to see” on demand course, does not seem to be linked to any target. Maybe you want to update this.
Pat Panchak says: September 2, 2022 at 10:33 amI fixed it. Thanks for the heads-up.